Per IOT host dns query form to allow deep dive into IOT queries
Setting of IOT dns server via dnsmasq. 9.9.9.9 is preferred/default
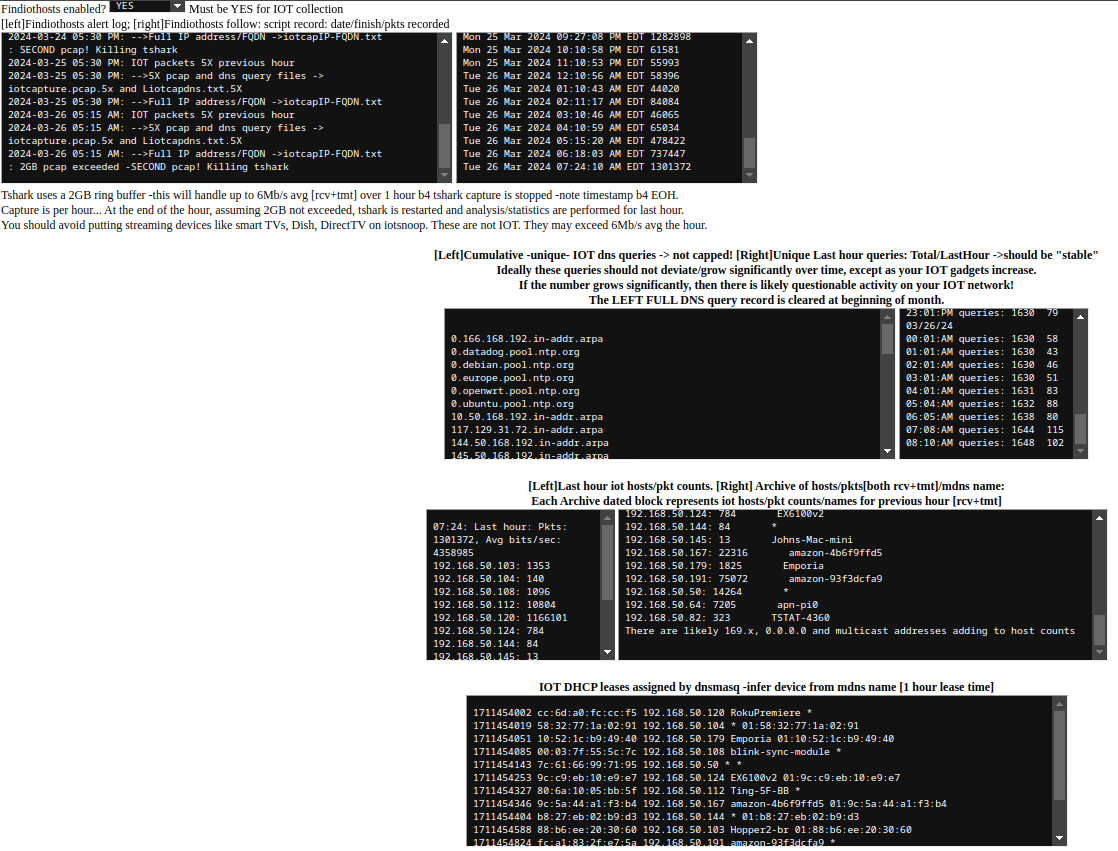
2GB packet capture limit works for 5-6 Mb/s average over the hour. Will work for single streaming svc OK.
4K streaming will overrun 2GB buffer in about 30min and terminate the capture/investigation. Amazon prime will do this. Need to test MIN, MED tshark environments.
3-26-2024: Version 1.1 image posted at sourceforge. There should be a version 1.2 by the end of April 2024. Always changes/improvements.
SDcard image is used for evaluation. The app is write intensive, and I will eventually have instructions/images for migration to USB/SSD devices
since the SDcards may not survive long term in this situation. A Quality SDcard like Sandisk ExtremePro is needed.
Successful testing for up to 2GB packet capture and analysis, representing about 6Mb/s [rcv+tmt] streams.
The capture is done hourly, by starting, stopping and examing packet captures and plotting and listing statistics.
Works successfully single streaming, youtube, foxnews etc streams, tho it should not be used in general for multiple streaming devices. Only the more
quiescent IOT devices.
I Will be evaluating capture filters to restrict to pkt headers, more data, higher rates, etc. Lots of things to investigate/improve.
Note this page for IOT stats collected [there is additional]. Zoom in to see!
 ]
]
3-9-2024: Lots of cleanup, iitialization work. Got iotsnoop running on mmcblkp0 [SD card], USB stick, and USB hard drive
Ready to create first img for download. This will not be a "beautiful" release, but it should function. I am using it on a 4GB pi4 with maybe 12 IOT
devices -no streaming TV!- up to 500,000 pkts/hr have been handled representing up to 2Mb/s rcv-tmt of IOT data.
I have an 8GB pi4 which I will be testing for increased IOT bandwidth.
But WHY would you want/let your IOT hog your bandwidth. The wifi APN is spec'd only for 802.11g -50Mbs.
The image is running on a 64GB SDcard, so the image will be created from that. Some funky booting, USB is enabled, but it traverses that.
You should consider transitioning a USB SSD drive. You can use "rpi-clone sda" e.g. to clone. More info coming.
Hope to have an iotsnoop image for testing in a week or so.!
3-2-2024: Lots of detail/initialization/anomaly work. Using 1GB/4GB pi4. Occasional oom-reaper events. Culling some memory hog services like pulseaudio.
Disabled display manager "lightdm" Renable via "systemctl start lightdm" followed by "startx" But beware, display manager gobbles resources.
BEWARE::!! The web page/plots will show NO info for hours/a day until stats are accumulated.
The "imonitorg" function is the same as the previous "imonitorg," the iotsnoop function runs hourly and analyzes collected packets and then plots/lists stats.
I will have updated screenshots/plots below in a few days -3/10 or 3/11
Really Neat! you can see all the IOT activity summarized! plots, hosts, dns requests. It even flags for 5X traffic events, etc. You can see the DNS
of the individual IOT devices. Now if I could do an API to check for malicious websites being accessed.
BEWARE::!! Most of the DNS requests are for CDN sites. amazon s3 servers, etc. etc. Much of this will not make sense.
I list DHCP leases, "off-network" attempts, non leased addresses, and error conditions, if e.g. tshark is having trouble running.
"Alerts" are inserted into the mail1 file, which you receive if you setup mail via gmail relay.
I have converted to the ring buffer "-b" instead of the "absolute" buffer "-B" option in tshark. "-B" causes oom events. Will need to investigate
but ring buffer works for much less memory used! 2GB max buffer is specified, which represents maybe 3 Mbs/ avg BW use over an hour.
2-17-2024: The main scripts are finished and undergoing review. Basic web page done. Four pages show the intent
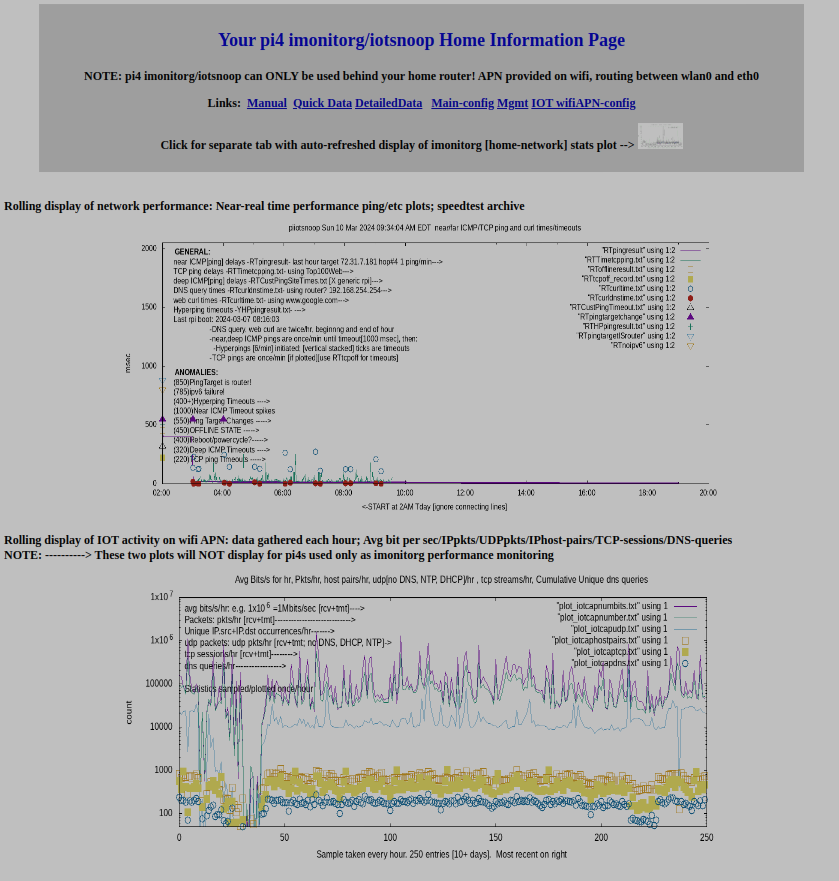
Main page, showing the imonitorg header and the link to the performance plot. The iotsnoop plot is below.
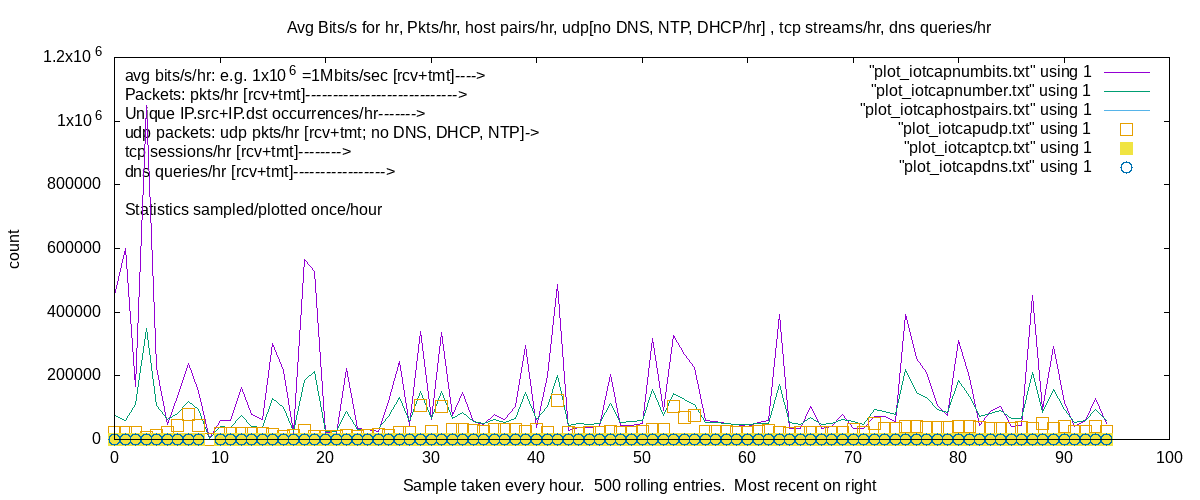
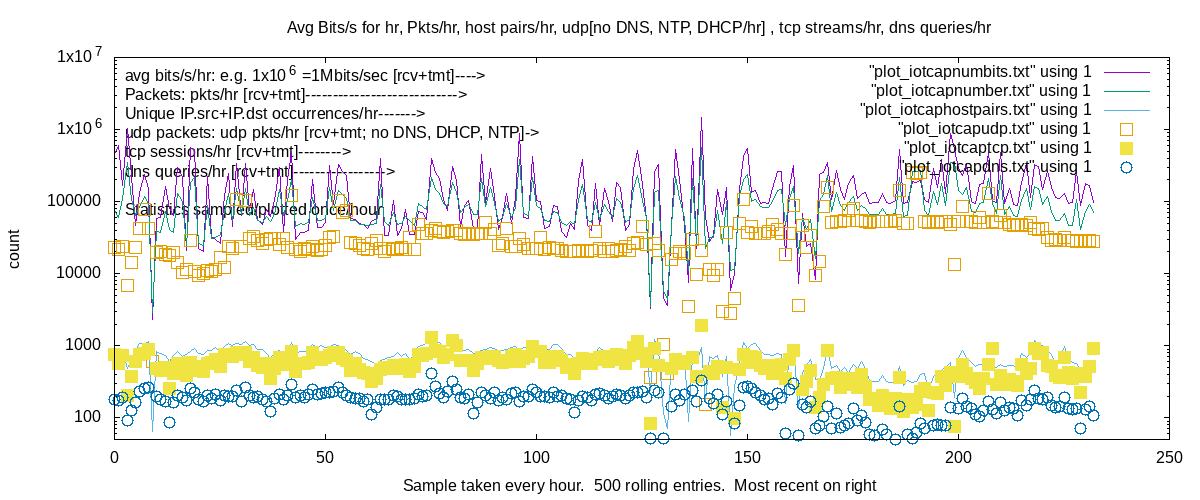
The iotsnoop plot shows the six main stats. Tshark [wireshark] is run for one hour, and stats collected. Repeat:
1. Bits tmt+rcv on the IOT wlan0 interface, plotted hourly
2. Packets tmt+rcv on the IOT wlan0 interface, plotted hourly. Compare bits to packets to detect heavy activity
3. IP hostpairs encountered, plotted hourly
4. UDP packets tmt+rcv, LESS DNS,DHCP,NTP, plotted hourly
5. TCP sessions SYN-ACK packets counted, plotted hourly.
6. DNS query and respnses, plotted hourly
I am trying to create a plot outpkts/inpkts which would give a good indication of normal/abuse.....
Early results show I can easily ID IOT devices and their activity by watching the plot, and then going into the iotsnoop details,
which show the individual hosts and their activity over the past hour.
Comparing the six plots gives me some idea of what is going on. Total bits >> packet count indicates downloads.
Excessive UDP or DNS peaks would show questionable flooding/bot activity.
I will add a tcpdump script to monitor for TCP SYNs from the IOT to the main LAN, which would indicate malicious probing by an IOT.
Currently I do not distinguish tmt from rcv, but hope to delineate where appropriate.
Suggestions for other monitoring is welcome. I have all the packets recorded each hour [except for the stop/start of tshark] appearing on the wifi interface!
Main webpage page below, showing imonitorg main realtime plot link and the main iotsnoop plot, described above in the six points.
Main page below fold, showing imonitorg stats "host" activity, plus persistent hosts. See imonitorg for info
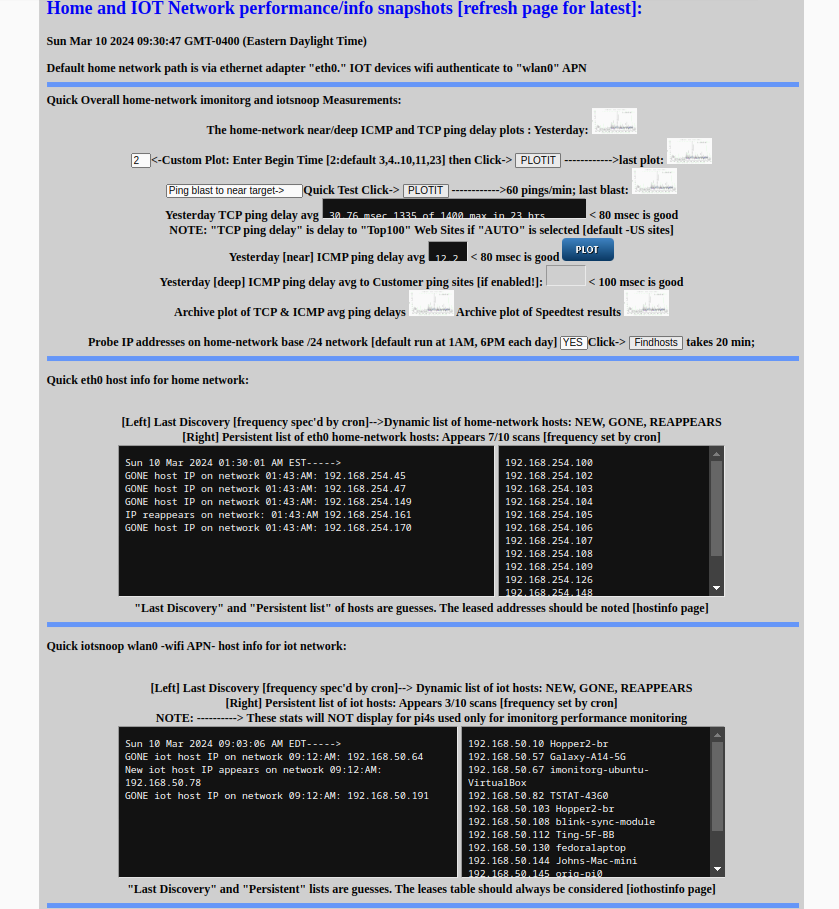
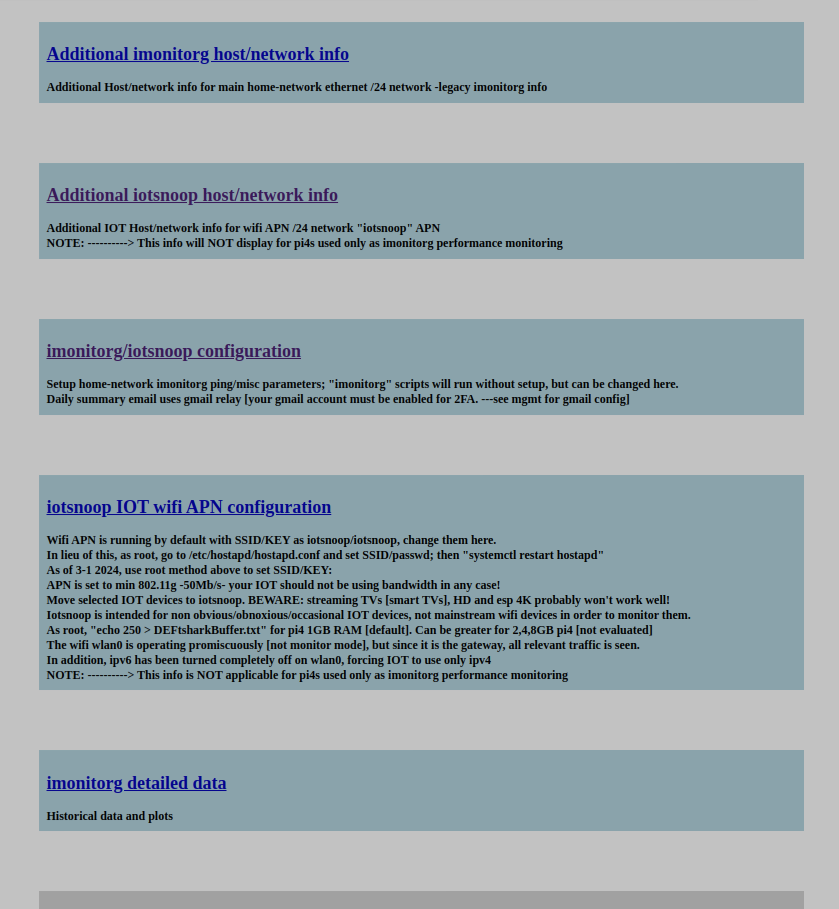
Main page below below fold showing Info and Links for configuration, mgmt, additional detailss
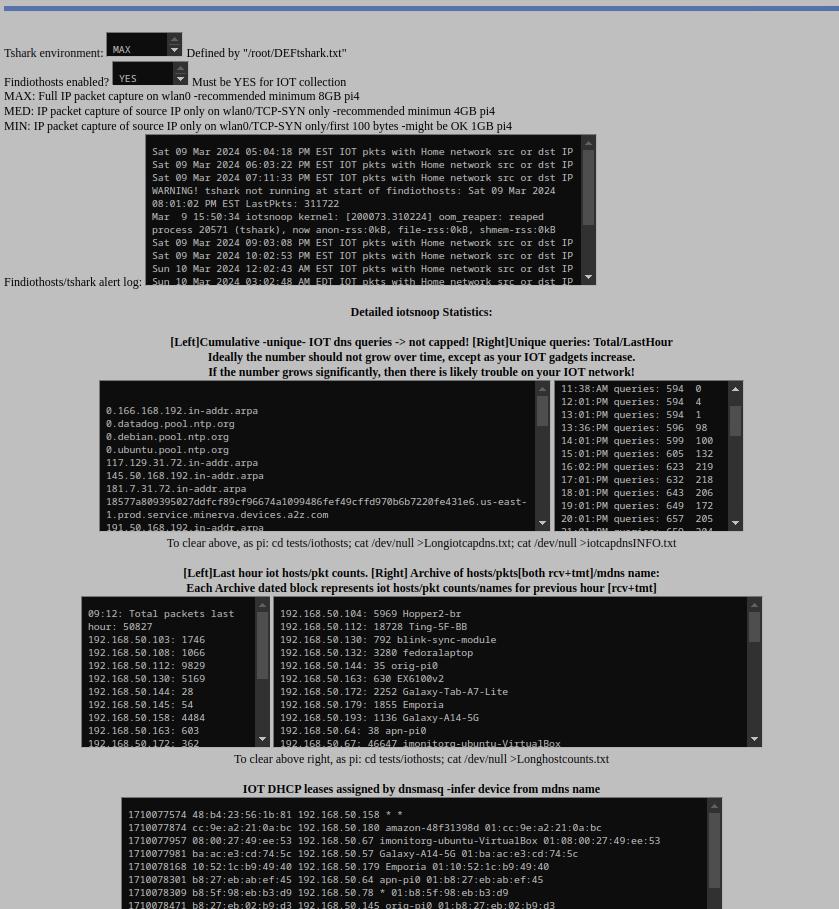
Details page [# on page] for iotsnoop, showing iotsnoop config/alerts/details, dns query archive, host and packet counts last hour, plus archive
 IOT plot
 Log IOT plot